iRidium Trend Component
Linear Trend Graphical Item
Linear Trend is used for graphic display of parameter changes in time.
To draw linear trends in the beta-version of iRidium 3.0, install OpenGL render in the settings of Emulator and Windows client. Open system settings of iRidium app (or the Emulator): F8 > password:2007 > Render tab> select OGL > Save & Exit. Restart the program. The trend won't be displyed in the app without this setting.
Creation
Select "Draw Item" tool one of these ways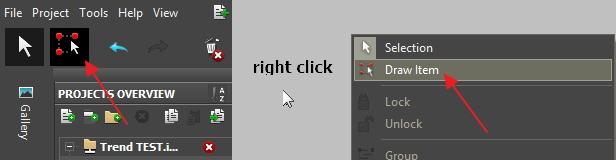
Create an object of required size
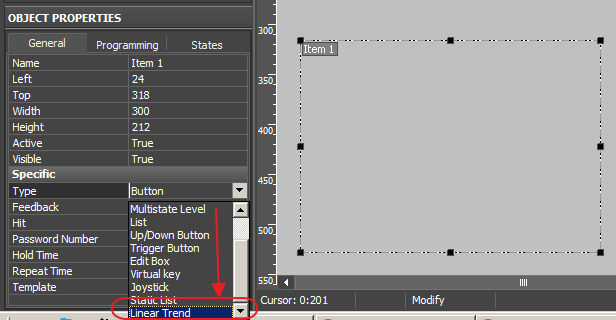
Select the type of object - Linear Trend
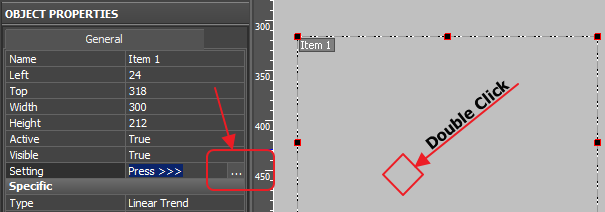
The editing window of Trend properties can be called in 2 ways:
Editing Linear Trend
General Tab
Basic trend settings are displayed here (type, color, opacity, etc.)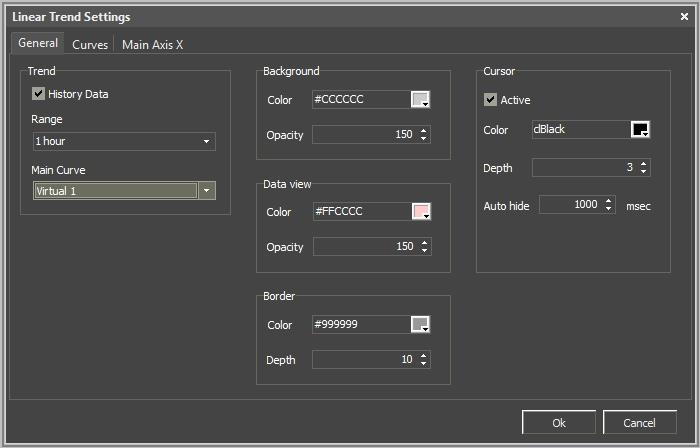
Work with database
History trend uploads value history, and does not add real time values .
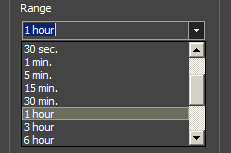
"Range" (range of trend) selects a range to display.
Main Curve shows which feedback displyed on the chart is the main one.
Design
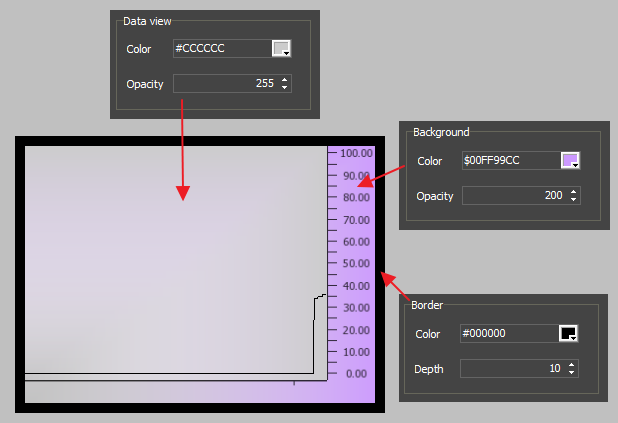
- Background - color and opasity of the scale field.
- Border - color and thickness of the frame
- Data View - color and opasity of the chart field.
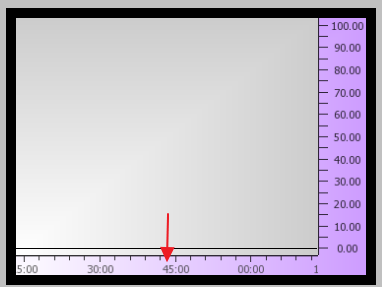
- Cursor - vertical line to visually hilight an area. It's responsible to the color and thickness of a line and time in ms that a line takes to disappers after appearing [Not realized in this version of the editor]
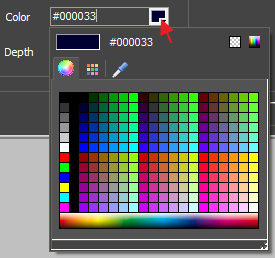
A color palette appear where you can select any color by clicking the left mouse button.
You can also use iRidium standard palette. To do it clicj the palette icon on the right top corner of the window. In the palette window that appears select the required color and click "Ок".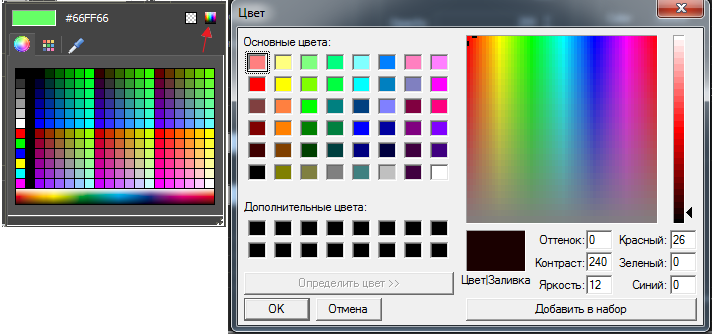
"Grab color" function is added. It's required when the palette does not have a required color, but some button in the editor has this color. It works this way:
1. Click "Grab color" in thepalette window.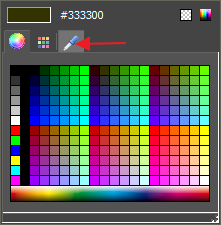 a working window appears
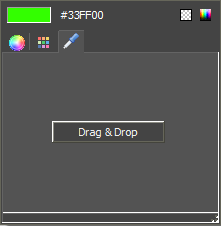
2. Click "Drag & Drop" icon with the left mouse button. After it the mouse pointer will look like a pipette. 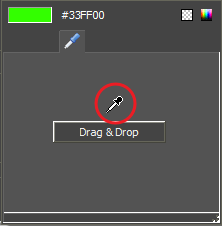
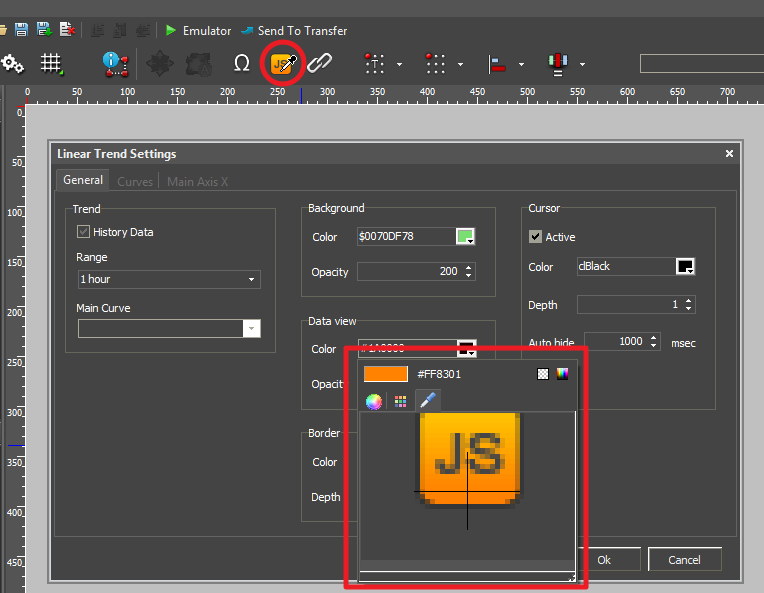
3. Keep the mouse button pressed, point the cursor at the required color in the editor window. For more convenient work the palette window is substituted with an enlarged screen at the top of which RGB code is displayed.
Curves Tab
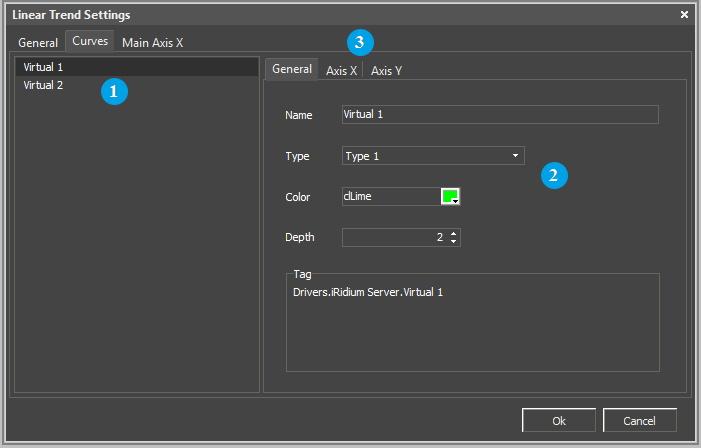
The tab has chart settings for every feedback channel.
- List of feedback channels added to the trend.
- The editing feild of a feedback chart contains:
- Name - name of feedback (can be changed).
- Type - chart behaviour when the server is on/off line.[Not realized in this version]
- Color - color of chart lines.
- Depth - thickness of lines.
- Tag - feedback full name, that can be used to call it in JavaScript editor
- Tabs to work with gradualtion scales.
Graduation scale of Х axis
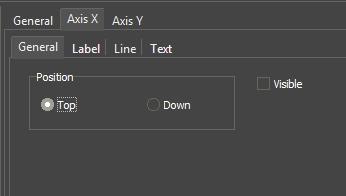
- General - settings of the scale location to the item. It can be Down.
-
- Top

- Label - settings of displaying measurement units.
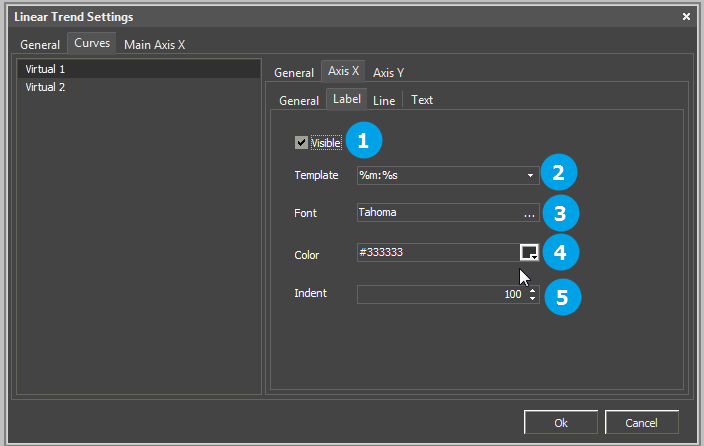
- 1 - visibility/invisibility of measurement units
- 2 - dropdown list of templates
- 3 - font
- 4 - font color
- 5 - Indent - space from the scale [Not realized in this version]
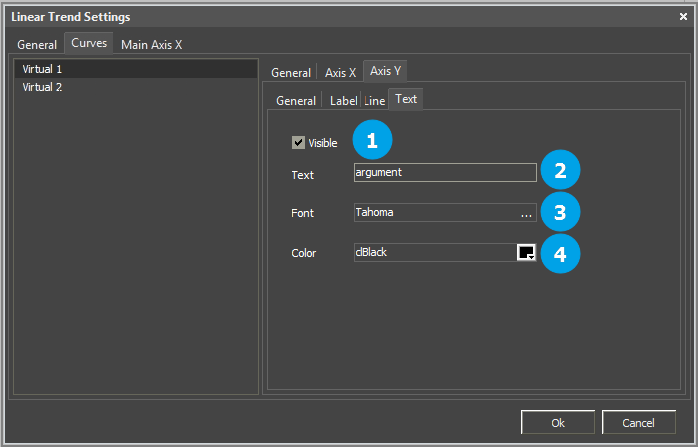
- Text - settings of text display
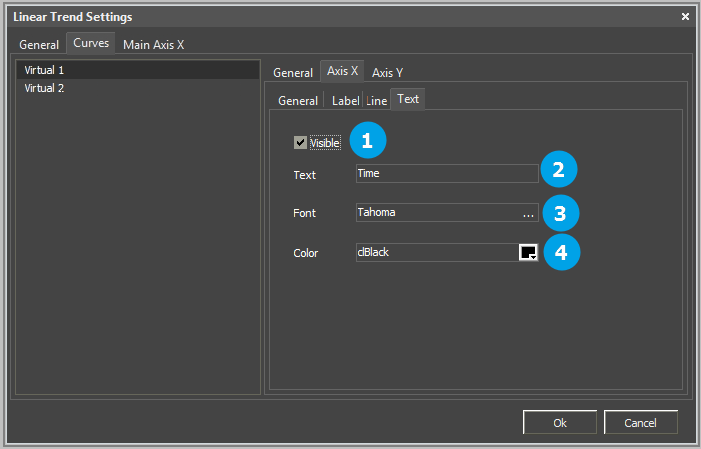
- 1 - text visibility/invisibility
- 2 - text to be display on the chart

- 3 - text font
- 4 - text color
- Line is responsible to the scale along X axis and its design.
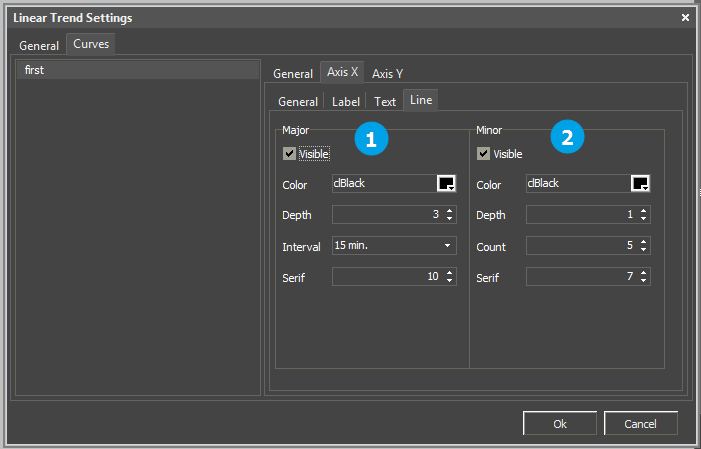
1 - "Major" field - main scale. It has the following settings:- Visibility/invisibility
- Color
- Thickness
- Interval - space between scale marks.
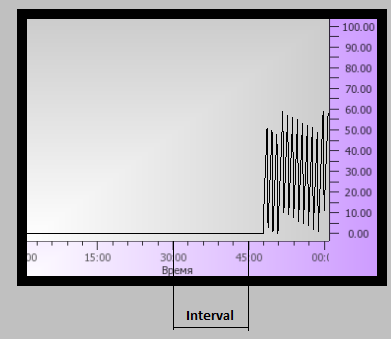
Interval can have a greater value than "Range" - Serif - length of one scale mark
- 2 - "Minor" field - additional scale. It has the following settings:
- Visibility/invisibility
- Color
- Thickness
- Count - number of areas, devided by and additional scale.
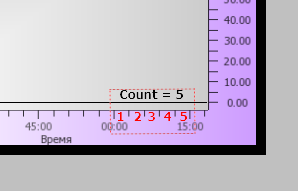
- Serif - length of one scale mark
Graduation scale of У axis
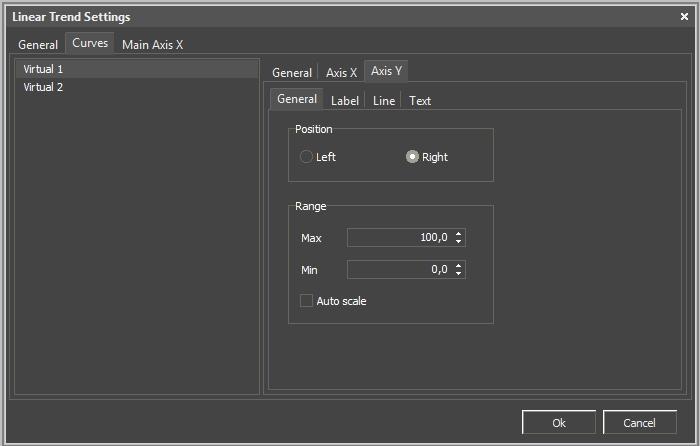
General tab
General - settings of the scale location to the item and the scale size.
It can be on the left 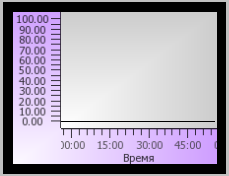 or on the right
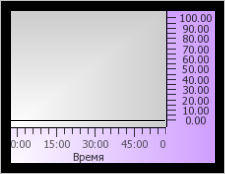
2 - Range field contains settings of the scale size.
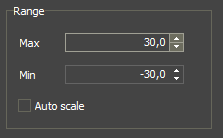
If there is a tick in the "Auto scale" field, tha scale with adjust to feedback value. For example, initially the scale ranger is from 0 to 100. If a value larger than 100 or lower than 0 comes to the feedback the scale changes.
Label tab
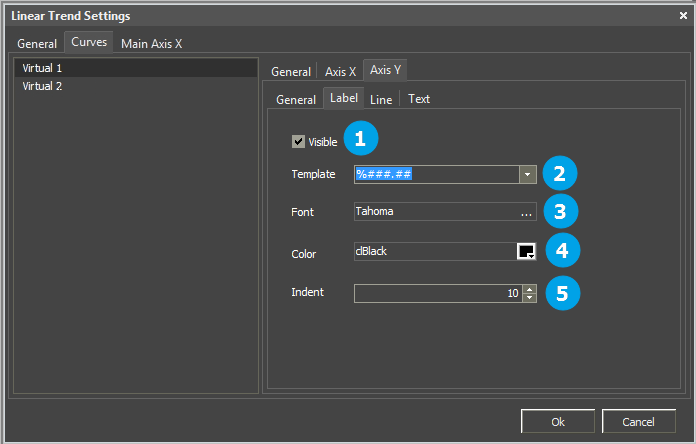
- Visibility/invisibility settings of measurement units
- Dropdown list of templates
- Font
- Color
- Indent - space from the scale [Not realized in the current version of the editor]
- Text visibility/invisibility
- Text to be displyed in the chart.
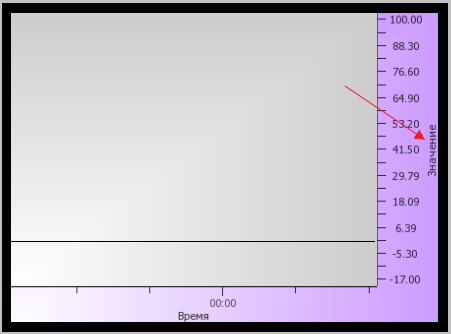
- Text font
- Text color
It works the same as Line for axis ОХ
Main Axis X tab
Work the same way as Line for X axis.
Customer support service by UserEcho